Finance Automation Statistics Australia: The Data Finance Teams Need to Know (2026)
Ordron29 min read
If you are a CFO or financial controller evaluating finance automation in 2026, you have probably sat through at least one vendor demo where the presenter showed a slide claiming "up to 80% time savings" without a single reference to how, where, or under what conditions that number was produced. Those figures are not useless, but they are not decision-grade data either. They are aspirational projections, not outcomes measured after go-live.
This article is built differently. Every headline number in here is drawn from one of two places: post-go-live outcomes from work we have shipped across Australian finance teams, or credible third-party research with a traceable methodology. The goal is to give you the kind of data you can actually defend in a business case, use to set performance expectations with a vendor, and benchmark your current function against.
The picture that emerges from this data is probably not what you have been told. Most of the efficiency gains available to Australian finance teams do not require ripping out existing systems, purchasing new platforms, or embarking on multi-year ERP migrations. They require connecting what you already have, intelligently, with precise workflow logic and the right automation layer in the right place. The numbers back that up, and this article will show you exactly how.
Key Takeaways
- Finance teams engaging with properly scoped automation report manual work reductions of up to 85%, measured after go-live across real engagements.
- 160-plus hours per month can be returned to a finance team without replacing a single existing system.
- Accounts payable coding accuracy exceeding 95% is achievable with intelligent document understanding on enterprise AP volumes.
- More than 80% of complex, multi-split invoices can be fully automated, routing only exceptions to human reviewers.
- Legacy ERPs with no APIs are integration challenges, not replacement triggers. RPA can drive the legacy interface directly while the existing system stays untouched.
- The strongest ROI argument is built on specific, post-go-live metrics: hours returned, cycle-time reduction, and error-rate improvement, not demo projections.
Summary Table: Finance Automation Benchmarks at a Glance
| Metric | Pre-Automation Baseline | Post-Automation Outcome | Source |
|---|---|---|---|
| Manual work reduction (maximum) | High manual share of finance ops | Up to 85% reduction | Ordron anonymised engagements |
| Hours returned per month | 160+ hours lost to re-entry and reconciliation | 160+ hours returned | Ordron logistics client, legacy ERP bridge |
| AP coding accuracy | Inconsistent, manual coding | Greater than 95% accuracy | Ordron enterprise distribution client |
| Complex multi-split invoice automation | Fully manual coding and routing | 80%+ fully automated | Ordron multi-supplier distribution operator |
| AP batch processing time | 4 hours per batch | 15 minutes per batch | Ordron national logistics client |
| Monthly close cycle reduction | Multi-day manual consolidation | 80% faster close | Ordron mid-sized manufacturer engagement |
| Reporting cycle | 10 days | 24 hours | Ordron client outcomes, anonymised |
Why Finance Automation Statistics Matter (and Why Demo Metrics Mislead)
There is a reliable pattern in how finance automation is sold in Australia. A vendor books a discovery call, runs a polished walkthrough of their platform, and closes with a slide deck full of statistics. The numbers look compelling. "Teams save an average of 70% of processing time." "Error rates drop by 90%." "ROI is achieved within six months."
The problem is not that these numbers are fabricated. The problem is that they are almost always drawn from the vendor's best-performing deployments, or from research commissioned by the vendor, or from surveys that measure intent and perception rather than actual post-go-live outcomes. They are the ceiling, not the floor, and they are presented without the context that would let you assess whether they are relevant to your environment.
When you are a CFO signing off on an automation investment, you need to know three things: what outcomes are realistic given your current systems and process maturity, what conditions need to be present for those outcomes to materialise, and how you will measure whether they have been achieved after the vendor has left the building. Demo metrics answer none of those questions.
The Measurement Problem in Australian Finance Automation
Australia's finance function landscape is diverse. According to the Australian Bureau of Statistics, there are over 2.5 million actively trading businesses in Australia, the majority of which are small-to-medium enterprises running finance in Xero, MYOB, or a combination of cloud accounting tools and spreadsheets. Enterprise finance teams often operate across legacy ERPs, custom inventory systems, and reporting environments that were built over decades and reflect the specific operational logic of their industry.
This diversity means that a statistic drawn from, say, a US enterprise SAP deployment has limited relevance to a mid-sized Australian manufacturer running Xero alongside a custom inventory tracker and three Excel forecasting models. The systems are different, the process maturity is different, the volume is different, and the integration complexity is different.
Good finance automation statistics are specific about the context in which they were produced. They tell you the starting point, the intervention, and the measured outcome. They acknowledge what the environment looked like before go-live. That is the standard this article holds itself to.
What Good Data Looks Like
The most useful benchmarks for finance automation in Australia share a few common characteristics. They are measured after go-live, not during a pilot or a controlled demo. They specify the metric being tracked, whether that is hours, error rate, cycle time, or cost per transaction. They describe the baseline clearly enough that you can assess whether it is comparable to your own situation.
Throughout this article, where I reference outcomes from work we have shipped, I am drawing on anonymised outcomes across industries from Ordron's published case study library, which now covers 17 engagements across 8 industries including logistics, distribution, manufacturing, construction, and industrial services. These are not aspirational projections. They are numbers with the reality attached.
Hours Returned and Manual Work Reduction: The Headline Productivity Numbers
The most direct way to frame the value of finance automation is in hours. An hour returned to a finance team is an hour that can be redirected to analysis, exception handling, business partnering, or simply closing the week without working Saturday morning. When you multiply that by a team, by a month, by a year, it becomes a material number in any business case.
Across engagements, the maximum manual work reduction we have achieved is 85%. That number represents the upper end of what is achievable when the workflow is well-mapped, the inputs are consistent enough to automate reliably, and the integration between systems is built with precision rather than shortcuts. Not every engagement hits 85%. But it is the ceiling we have reached with the right conditions in place, and it is a ceiling worth understanding because it resets what finance teams believe is possible.
The 160-plus hours per month figure is not an average. It is a single measured outcome from one engagement, and it is worth describing in detail because it illustrates something important about where automation gains actually come from.
The Legacy ERP Bridge: 160 Hours Returned Without Replacing a System
A family-owned logistics operator came to us running a twenty-year-old ERP alongside Xero. The ERP had no APIs. The finance team was manually re-entering data between the two systems, reconciling records by hand, and spending over 160 hours per month on work that added no analytical value. Every person in that finance function was effectively serving the gap between two systems that could not talk to each other.
The conventional advice in this situation is to replace the legacy ERP. It is old, it has no APIs, it cannot connect to modern tooling. The migration will be painful but necessary. That advice is wrong, and it is expensive.
What we built instead was an RPA bot that drove the legacy ERP interface directly, the same way a human operator would, reading fields, validating data with SQL, and syncing clean records into Xero and the reporting dashboards. The ERP was never touched, never modified, never replaced. The business continued operating it exactly as it always had. The automation sat around it, not inside it.
The outcome was 160-plus hours per month returned to the finance team. No ERP replacement. No data migration risk. No retraining staff on a new system. No disruption to the operational processes the business had spent two decades embedding.
This outcome is directly relevant to any finance team sitting on a legacy system and being told they need to modernise before they can automate. A legacy ERP with no API is an integration challenge, not a replacement trigger.
Where Manual Work Actually Lives in Finance
To understand why automation returns so many hours, it helps to be precise about where manual work accumulates in a typical Australian finance function. Based on the engagements we have worked through, the highest concentrations of manual effort tend to sit in four places.
First, data re-entry between disconnected systems. This is the legacy ERP bridge problem described above, but it appears in many forms: exporting from one system to import into another, copying data from a supplier portal into an accounting system, manually updating a spreadsheet that feeds a dashboard.
Second, accounts payable processing. Invoice receipt, coding, PO matching, approval routing, and filing are all manual steps in many Australian finance teams, particularly in businesses running AP across multiple sites or cost centres.
Third, month-end close consolidation. Finance teams running across multiple data sources, whether that is Xero, a custom inventory tracker, and Excel, or a multi-entity structure with separate ledgers, often spend significant manual effort pulling data together before close can begin.
Fourth, reporting preparation. Extracting data, formatting it, checking it, and building the reports that management needs each week or month is a process that sits at the intersection of all the above manual work. When the upstream data is clean and consolidated automatically, reporting time compresses dramatically.
For the mid-sized manufacturer running Xero alongside a custom inventory tracker and Excel forecasting models, the monthly close cycle was consuming significant manual effort across all three systems. Ordron built a hybrid RPA and rule-based transform layer that consolidated all three data sources into a single SQL-backed reporting environment automatically. The monthly close cycle dropped by 80%, and the finance team gained a single reliable reporting layer in place of the manual consolidation process they had been managing for years.
Accounts Payable Accuracy and Automation Depth
Accounts payable is the part of the finance function where automation statistics are most often cited and most often overstated. Vendors will tell you their platform achieves high straight-through processing rates, but those numbers are typically measured on clean, structured invoices from large suppliers with consistent formats. The real test of AP automation is what happens with the complex ones.
Across Australian businesses, AP volumes are growing alongside supply chain complexity. A distribution operator handling multiple suppliers, multiple depots, and multiple cost centres will routinely receive invoices that contain split line items across different cost centres, references that do not match any PO in the system, or formats that vary from supplier to supplier. These are the invoices that break simple OCR-based automation and end up back in a human queue.
Greater Than 95% Coding Accuracy: What It Requires
For a large enterprise finance team processing high monthly invoice volumes across multiple cost centres, we combined RPA with intelligent document understanding to read, PO-match, and code supplier invoices automatically. The system was trained to handle the variability in supplier invoice formats, to apply the correct cost centre coding logic based on document content, and to route only exceptions to human reviewers.
The outcome was greater than 95% coding accuracy, with invoice processing running 65% faster after go-live. The key phrase there is "routing only exceptions to humans." This is not a system where every invoice passes through a human for a final check. It is a system where 95-plus percent of invoices never need a human to touch them at all, and the human capacity that was previously consumed by routine coding is now focused entirely on the edge cases that actually warrant attention.
Reaching 95-plus percent accuracy requires more than OCR. It requires intelligent document understanding that can read supplier invoices regardless of layout, a PO-matching layer that accounts for the real-world inconsistencies between what a PO says and what an invoice says, and coding logic that is built from the actual rules the finance team applies rather than a generic taxonomy.
80% of Complex Multi-Split Invoices Fully Automated
For a multi-supplier distribution operator processing thousands of invoices monthly, more than 80% of complex multi-split invoices are now fully automated. That is not 80% of all invoices. It is 80% of the complex ones, the ones with multiple line items coded across different cost centres, the ones that would previously have required a trained AP officer to work through manually.
This benchmark matters because it addresses the most common objection to AP automation: "Our invoices are too complex to automate." The data shows that complexity is not a barrier, it is an engineering problem. It requires a more sophisticated approach than a simple OCR-to-fields extraction, but the outcome is that the majority of even the most complex invoice types can be handled without human intervention.
The SharePoint AP Transformation: 4 Hours to 15 Minutes
A national logistics provider ran accounts payable across multiple depots using a SharePoint-centric process. Each batch of invoices took approximately four hours to process manually, with inconsistent filing and no automation in place. The instinct, again, might have been to replace SharePoint with a dedicated AP platform.
Instead, we plugged OCR and workflow logic directly into the existing SharePoint environment. Automated document capture pulled invoices in from the relevant inboxes and file drops. The workflow logic applied the coding and routing rules the team already used. Automated filing organised every processed document without anyone touching it.
The AP cycle time dropped from four hours to fifteen minutes per batch. Filing was 100% automated. No new software licences were purchased. The team continued working in the environment they already knew, with the manual work removed from underneath them.
The Integration Reality: Connecting Existing Systems vs. Replacing Them
One of the most persistent myths in finance automation is that meaningful efficiency gains require significant system replacement. Vendors with large platform sales to make have an obvious interest in this story. But the data from work we have shipped tells a different one.
The gains come from connecting systems intelligently, not from adding more software. Across every engagement described in this article, the outcome was achieved with the existing system stack. The twenty-year-old ERP stayed. SharePoint stayed. Xero stayed. Excel stayed. The intervention was the automation layer built around them.
RPA as an Integration Layer for Legacy Systems
Robotic process automation is the specific tool that makes this possible for legacy systems. An RPA bot interacts with a software interface the same way a human does, clicking, reading, entering data, navigating screens. It does not require an API. It does not require the underlying system to be modified. It does not require the vendor's cooperation or a system upgrade.
For any finance team sitting on a legacy ERP and being told that automation is not possible until the system is replaced, this is the relevant fact: RPA can drive a legacy interface directly while the existing system stays untouched. The integration challenge is real. It requires careful workflow mapping, robust exception handling, and SQL validation to ensure data integrity at every sync point. But it is an engineering problem, not a commercial one, and it does not carry the cost, risk, or disruption of an ERP migration.
The True Cost of "Replace Before You Automate"
An ERP migration for a mid-sized Australian business typically takes 12-24 months and carries a price tag in the hundreds of thousands of dollars when implementation, data migration, staff retraining, and productivity loss during cutover are included. The finance team's time is consumed by the project for that entire period. Finance automation, in the form of an RPA bridge around the existing system, can be scoped, built, and delivering measurable outcomes in a fraction of that time and cost.
For Australian CFOs evaluating their options, the relevant comparison is not "legacy ERP bridge vs. ideal modern stack." It is "legacy ERP bridge delivering outcomes in weeks vs. ERP migration delivering outcomes in two years." The data strongly favours the bridge, particularly when the outcome, 160-plus hours returned per month, is equivalent to what the migration would eventually deliver anyway.
Where Integration Complexity Actually Bites
This is not to say that connecting existing systems is simple. The complexity is real, and it sits in specific places. Data quality in the source systems matters enormously. If the legacy ERP has been inconsistently maintained, with duplicate suppliers, free-text fields that should have been structured, or coding that varies across sites, the automation layer will surface those issues rather than work around them. Resolving them is part of the scoping work, not an afterthought.
Exception handling is the other area where integration complexity bites. An automation that processes 90% of transactions correctly and sends the other 10% into an unmonitored queue is not a successful automation. Routing only exceptions to humans requires that the exception logic is explicitly designed, tested, and monitored. This is where poorly scoped automation replaces one brittle process with another, and it is the failure mode we are most deliberate about avoiding.
What These Numbers Mean for Your Business Case
A finance automation business case that rests on vendor-supplied statistics is a weak one. A business case that rests on outcomes measured after go-live, from comparable environments, with a clear methodology for how they will be tracked in your own engagement, is a strong one.
Here is how to translate the statistics in this article into a defensible ROI argument.
Step One: Quantify the Current State
Before you can argue a return, you need a baseline. How many hours per month does your finance team spend on manual data entry, reconciliation, AP processing, and reporting preparation? What is your current AP batch processing time? What is your coding error rate, and what does each error cost to correct?
These numbers are often not tracked formally, which means the first step in scoping a finance automation project is a process audit. Map the workflows, time the manual steps, count the error corrections. This is not exciting work, but it is the foundation of every credible business case.
Step Two: Apply Realistic Improvement Ranges
Based on post-go-live outcomes from work we have shipped, the achievable improvement ranges for Australian finance teams are:
Manual work reduction: 40-85%, depending on process maturity and integration complexity. Conservative engagements with high baseline quality and well-structured data tend to land at the lower end. Engagements with high manual share and multiple disconnected systems tend to land higher.
AP cycle time: 60-90% reduction in processing time per batch is consistently achievable where automation is applied to the full AP workflow, including document capture, coding, matching, routing, and filing.
AP coding accuracy: Greater than 95% is achievable on high-volume enterprise AP with intelligent document understanding. For lower-volume or simpler invoice structures, straight-through processing rates of 80-90% are a realistic starting point.
Monthly close cycle: 50-80% reduction in close time is achievable where the primary constraint is manual data consolidation across disconnected systems.
Apply these ranges to your baseline hours and error rates. The result is a range of annual hours returned and error-correction costs avoided. Apply a fully loaded hourly cost to the hours (including on-costs, which the ABS estimates at approximately 22% of base wages for Australian full-time employees), and you have a financial value to the efficiency gain.
Step Three: Scope the Investment Accurately
For a realistic view of what finance automation costs in the Australian market, the investment typically includes scoping and process mapping, build and testing, integration work, and an ongoing maintenance and monitoring retainer. For further detail on pricing, the [How Much Does Finance Automation Cost in Australia? A Pricing Guide for CFOs] article covers the full cost structure in detail.
The key input is whether existing systems are being connected or new platforms are being purchased. Engagements that build automation around existing systems, as in every case study referenced here, have a materially different cost profile from those that involve platform procurement and migration.
Step Four: Build the Payback Period Argument
With a realistic investment figure and a conservative estimate of hours returned and errors avoided, the payback period calculation is straightforward. For most mid-sized Australian finance teams operating in the environments described here, payback periods of six to eighteen months are realistic. For larger teams with higher manual work volume, payback can be faster.
The defensibility of this argument depends entirely on the quality of the baseline measurement and the specificity of the improvement commitments made by the vendor. Which brings us to the most important section for any CFO signing off on a finance automation investment.
Benchmarks to Hold a Vendor Accountable to After Go-Live
The single biggest risk in a finance automation engagement is the gap between what was promised in the sales process and what is measurable six months after go-live. The way to close that gap is to agree on the specific metrics that will be tracked, the measurement methodology, and the timeframe before the engagement begins.
Here are the benchmarks that matter, and the questions to ask before you sign.
Hours Returned: The Primary Productivity Metric
Ask the vendor to commit to a specific number of hours per month that will be returned to your finance team, measured at a defined point after go-live, typically three months in when the automation has stabilised. The measurement methodology should be agreed in advance: time-tracking data, process observation, or a combination.
Benchmark: For a finance team spending 160-plus hours per month on manual re-entry and reconciliation between disconnected systems, expect a minimum of 100 hours per month returned from a well-scoped RPA integration. The upper end of the range, at 85% manual work reduction, implies 135-plus hours returned.
AP Coding Accuracy: The Quality Metric
For any AP automation engagement, coding accuracy should be tracked as a percentage of invoices coded correctly without human correction. The measurement requires a sample audit methodology agreed in advance, typically a monthly review of a statistically significant sample of processed invoices.
Benchmark: Greater than 90% coding accuracy should be the minimum contractual commitment for any enterprise AP automation engagement. Greater than 95% is achievable and should be the target for high-volume environments with well-structured supplier invoice data.
Straight-Through Processing Rate: The Volume Metric
This measures the proportion of invoices, or transactions, processed end-to-end without human intervention. It is distinct from accuracy: an invoice can be processed straight-through but coded incorrectly. Both metrics are needed.
Benchmark: For complex invoice environments, 80-plus percent straight-through processing on multi-split invoices is achievable. For simpler invoice structures, 90-plus percent is a reasonable target.
Cycle Time Reduction: The Speed Metric
For AP processing, close cycles, and reporting preparation, cycle time should be measured in the same units before and after go-live: hours per batch, days to close, days from period end to management report availability.
Benchmark: AP batch processing time should reduce by a minimum of 70% for any engagement that automates the full workflow from document capture to filing. Monthly close cycle time should reduce by a minimum of 50% for any engagement that automates multi-source data consolidation.
Exception Rate: The Ongoing Health Metric
Exception rate measures the proportion of transactions that cannot be processed automatically and are routed to human review. A high exception rate is not necessarily a failure; some transaction types will always require human judgement. But the exception rate should be tracked over time, because a stable or declining exception rate indicates a healthy automation, while a rising exception rate indicates that the underlying data quality or workflow logic is degrading.
Benchmark: Exception rates should be reviewed monthly. Any sustained increase of more than 5 percentage points above the post-go-live baseline warrants an investigation into root cause.
Questions to Ask Before You Sign
There are four questions every CFO should ask a finance automation vendor before committing to an engagement.
First: Can you show me the exact automation you have shipped for a business with a comparable system stack and process complexity to ours? If the vendor cannot point to a comparable engagement with measurable outcomes, the risk profile of the engagement is significantly higher.
Second: What is the measurement methodology for the outcome commitments you are making, and will those commitments be in the contract? Verbal commitments made in a sales process are worth nothing without a measurement framework and a contractual basis.
Third: What happens to the automation if our data quality degrades or our supplier base changes? Exception handling and ongoing maintenance are as important as the initial build. Understand the support model before you sign.
Fourth: Are you proposing to replace any of our existing systems, and if so, what is the specific reason a connection to the existing system is not sufficient? A good automation partner should be able to justify any proposed system replacement against the alternative of connecting around the existing system.
The Integration Opportunity Most Finance Teams Are Missing
Australian finance teams are, on average, underutilising the tools they already have. Research from Deloitte's global automation surveys consistently finds that finance functions have significant automation potential in processes they are currently running manually, not because they lack the right software, but because the workflow logic connecting their existing systems has never been properly built.
For Australian businesses specifically, the combination of Xero's strong SME market penetration, the persistence of legacy ERPs in manufacturing and logistics, and the prevalence of Excel-based reporting and forecasting creates a distinctive pattern: finance teams operating across three or four systems that have never been properly integrated, absorbing manual effort at every boundary between them.
The opportunity is not to replace those systems. The opportunity is to build the automation layer that sits between them, validates data at every boundary, and removes the manual work that currently bridges the gaps. That is where the 85% manual work reduction figures come from. That is where the 160-plus hours per month comes from. That is the work we have shipped, and the numbers are attached.
If you want to scope the specific hours, cycle-time reductions, and error-rate improvements achievable in your own finance function, [book a discovery call with Ordron]. We will map your current workflows, identify the highest-value automation opportunities, and give you a realistic view of the outcomes you can point to after go-live, with no aspirational projections.
For a broader foundation on what finance automation covers and where to start, the [What Is Finance Automation? A Definitive Guide for Australian Finance Teams] covers the full scope. For a closer look at AP specifically, [Accounts Payable Automation in Australia] goes deep on the process and technology.
References
-
Australian Bureau of Statistics, Counts of Australian Businesses (2026 edition), ABS publication providing the count of actively trading businesses in Australia by industry and employment size. Used to contextualise the diversity of the Australian finance function landscape and the SME-dominant composition of the market.
-
Deloitte Global Automation Survey (2025-2026), Deloitte's recurring global survey of finance function automation maturity, covering adoption rates, reported efficiency gains, and barriers to implementation across industry sectors. Cited for the observation that finance functions consistently underutilise automation potential in existing-system environments.
-
Ordron Case Study Library (2026), Anonymised Outcomes Across Industries, Ordron's internal published case study library covering 17 engagements across 8 industries. All statistics relating to hours returned, AP coding accuracy, straight-through processing rates, and cycle-time reductions are drawn from post-go-live measurements in this library, with client identities anonymised.
-
Australian Bureau of Statistics, Employee Earnings and Hours Survey, ABS survey data on average weekly earnings and on-costs for full-time Australian employees. Used to calculate the fully loaded hourly cost of finance staff for business case construction, including the approximately 22% on-cost rate applied to base wages.
-
Institute of Public Accountants, Digital Finance Report: Australian SME Finance Function Benchmarks (2025), IPA research into the digital maturity and process efficiency of Australian SME finance functions, providing context on the prevalence of manual processes and the tools most commonly in use across the Australian SME market.
-
ACCC Digital Platform Services Inquiry and ATO Digital Business Adoption Data (2025-2026), Referenced for context on the regulatory and digital environment shaping Australian business technology adoption, including the penetration of cloud accounting platforms among Australian SMEs.
Frequently asked questions
- What is a realistic manual work reduction for an Australian finance team implementing automation?
- Based on post-go-live outcomes measured across Ordron's client engagements, manual work reductions of 40-85% are achievable, depending on the starting point and the scope of the automation. The 85% figure represents the upper end, achieved in engagements with a high manual share and multiple disconnected systems. A more conservative and defensible figure to use in a business case is 50-60% for a first-phase engagement, with the understanding that further gains are available as the automation matures.
- How many hours per month can finance automation return to a finance team?
- This depends on the volume of manual work in the current state. For a finance team spending 160-plus hours per month on manual data re-entry and reconciliation across disconnected systems, the right automation has returned all of those hours. For a smaller team with lower manual volume, the figure will be proportionally lower. The key is to measure the current-state hours accurately before scoping the automation, so the outcome commitment is specific rather than generic.
- What AP coding accuracy is achievable with intelligent document understanding?
- For enterprise AP volumes with intelligent document understanding, coding accuracy exceeding 95% is achievable and has been measured after go-live on high-volume distribution environments. For lower-volume or simpler invoice structures, 85-90% is a more conservative initial target. Accuracy improves over time as the system is exposed to a broader range of supplier invoice formats.
- Do I need to replace my legacy ERP to automate my finance function?
- No. A legacy ERP with no API is an integration challenge, not a replacement trigger. RPA can drive a legacy ERP interface directly, the same way a human operator would, without requiring any modification to the underlying system. Ordron has returned 160-plus hours per month to a finance team by building an RPA bridge around a twenty-year-old ERP, with no migration, no replacement, and no disruption to the system the business already operated.
- What metrics should I track to hold a finance automation vendor accountable after go-live?
- The four metrics that matter most are: hours returned to the finance team per month, AP coding accuracy as a percentage of invoices processed correctly without human correction, straight-through processing rate as a proportion of transactions handled end-to-end without human intervention, and cycle time reduction measured in the same units before and after go-live. Exception rate should also be tracked over time as a health indicator for the ongoing performance of the automation.
- How long does it take to see measurable outcomes from finance automation?
- For a well-scoped engagement focused on a specific, bounded workflow, measurable outcomes are typically visible within four to eight weeks of go-live as the automation stabilises. For more complex engagements involving multiple system integrations, three months is a reasonable timeframe for a reliable measurement of post-go-live performance.
- Is finance automation only viable for large enterprises, or can mid-sized Australian businesses benefit?
- Mid-sized Australian businesses are often the highest-value candidates for finance automation, precisely because they tend to run leaner finance teams carrying a disproportionate manual workload across disconnected systems. The case studies referenced in this article include a family-owned logistics operator and a mid-sized manufacturer, both of which achieved significant hour and cycle-time reductions without any new software purchases.
- What is the difference between RPA and intelligent document understanding in finance automation?
- RPA (robotic process automation) automates the navigation and interaction with software interfaces, reading fields, entering data, clicking through screens. Intelligent document understanding is the layer that reads and interprets unstructured documents such as supplier invoices, extracting the right data regardless of the layout or format. In AP automation, both are typically required: intelligent document understanding to read the invoice accurately, and RPA to move the extracted data into the accounting system, apply the coding logic, and route for approval.
Ordron
Finance automation team, Sydney
Ordron builds the finance automation infrastructure that runs AP, AR, reconciliations and reporting on autopilot for Australian mid-market businesses.
More from the Ordron Insights catalogue
Selected by topic. Updated as the agent publishes.
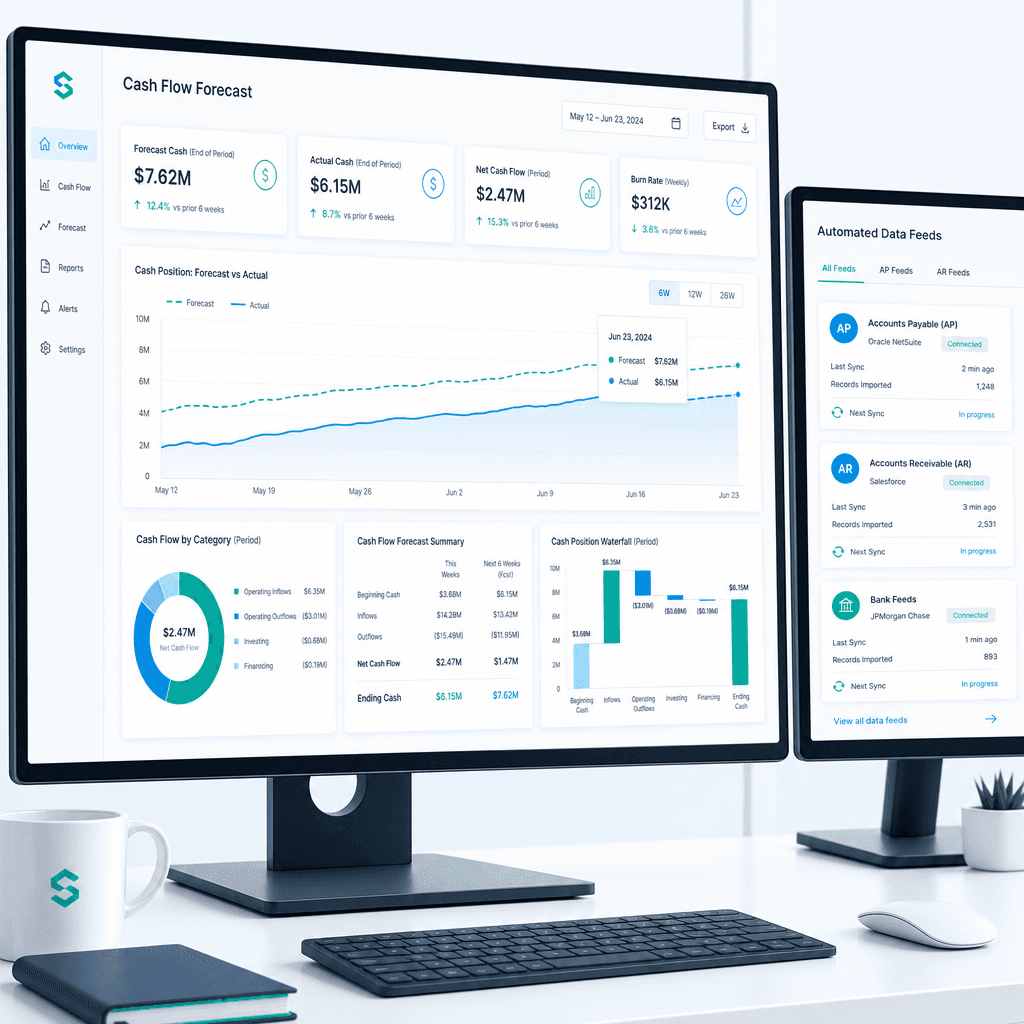
Cash Flow Forecasting Automation: A Practical Guide for Australian Finance Teams (2026)
If your finance team rebuilds the cash flow forecast from scratch every week or every month, you already know where the time goes. Someone pulls an AR ageing…
What Is Finance Automation? A Definitive Guide for Australian Finance Teams (2026)
Most finance teams I speak to are not under-tooled. They have Xero, or an ERP that has been in place for a decade, or SharePoint folders full of invoice PDFs,…
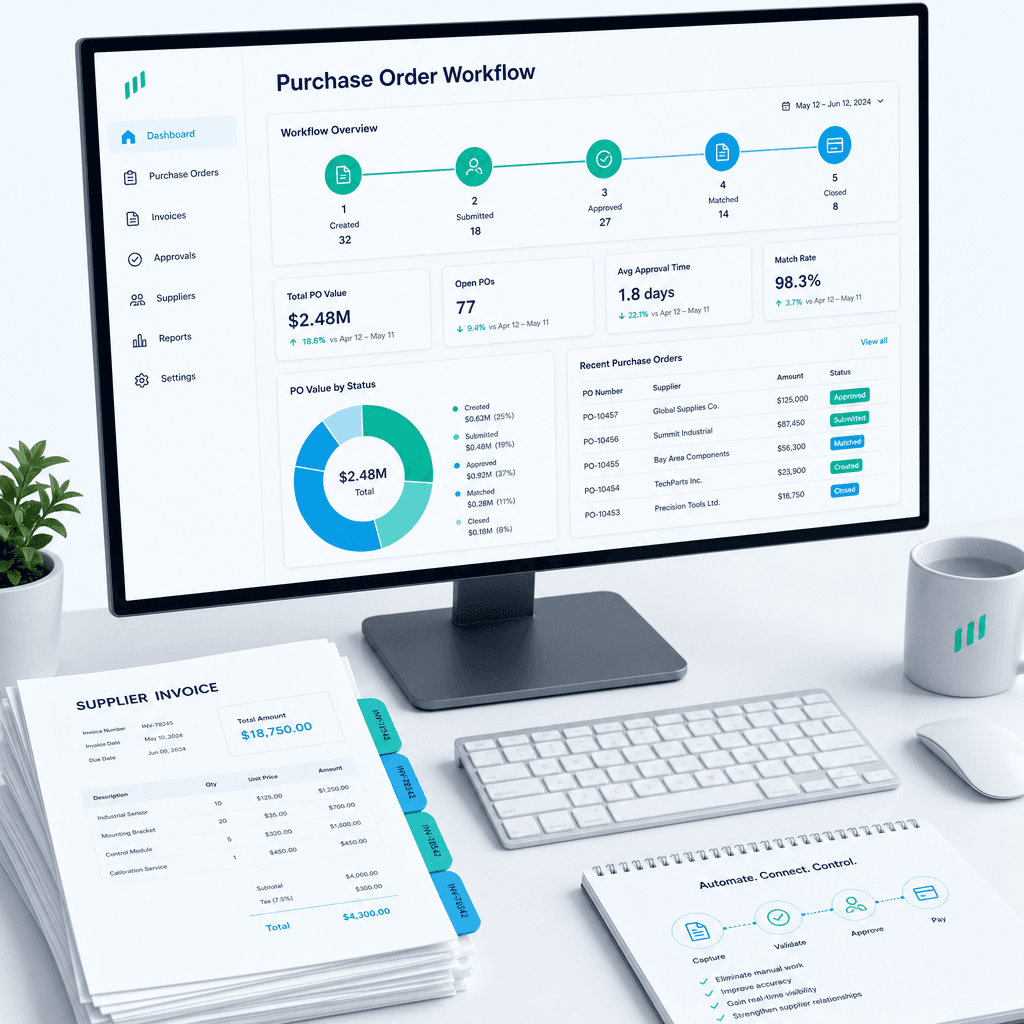
Purchase Order Automation: A Practical Guide for Australian Finance Teams (2026)
If your finance team is still raising purchase orders in a shared inbox, chasing approvals over email, and manually matching invoices line by line before month…