How to Automate Financial Reporting in Australia: A Practical Guide for Finance Teams
Ordron21 min read
Most Australian finance teams still rebuild their board pack from scratch every month. The month-end close finishes, someone opens Excel, pastes in data from Xero or the ERP, reformats the P&L, fixes the comparatives, and sends a PDF to the board three days later than anyone wanted. The process is not just slow. It is fragile, error-prone, and it consumes the time of your most capable people.
The irony is that the data already exists. The issue is not a lack of information. It is that the workflow connecting source systems to finished reports is manual, and manual workflows break under pressure, scale poorly, and deliver results too late to influence the decisions they are supposed to support.
This guide is for Australian finance teams who want to change that. I will walk through why reporting lags behind close, how to integrate data from Xero, MYOB and legacy ERPs, how to build automated dashboards and consolidated reports, and what it takes to produce ATO-compliant and audit-ready outputs automatically. Where I reference outcomes, those are numbers attached to real engagements, not aspirational projections.
Key Takeaways
- Manual reporting workflows are the primary cause of reporting lag, not data volume or complexity.
- Automating financial reporting does not require replacing your existing systems. The best results often come from wiring current tools together properly.
- Integration between Xero, MYOB, legacy ERPs and a reporting layer is achievable with RPA, API connectors and SQL validation, without a platform migration.
- Real-time dashboards and scheduled board-pack automation can coexist. Each serves a different audience and decision cadence.
- Australian-specific requirements including GST treatment, multi-entity AASB consolidation and ATO audit trails must be designed into automated reporting from the start, not retrofitted.
- Data quality is the gating constraint. Automation amplifies whatever is already in your source systems, clean or otherwise.
Summary Table: Report Type, Manual Pain, and Automated Approach
| Report Type | Manual Pain | Automated Approach |
|---|---|---|
| Profit & Loss | Monthly rebuild in Excel, manual variance notes | Connected to GL, auto-populates with prior-period comparatives and variance flags |
| Balance Sheet | Reconciliation delays, manual intercompany eliminations | Auto-reconciled from source, intercompany offsets applied at consolidation layer |
| Cash Flow | Reconstructed from bank statements and GL after close | Direct-method cash flow pulled from live bank feeds and categorised GL transactions |
| KPI Dashboards | Compiled from multiple spreadsheets, delivered days after close | Live dashboard connected to operational and financial data, refreshed on schedule |
| Consolidations | Manual roll-up across entities, currency adjustments done in Excel | Automated entity roll-up with FX rates applied, eliminations run on a rules engine |
| Variance Analysis | Written manually by a senior analyst, often rushed | Variance calculated automatically, commentary triggers generated from threshold rules |
Why Financial Reporting Lags Month-End Close
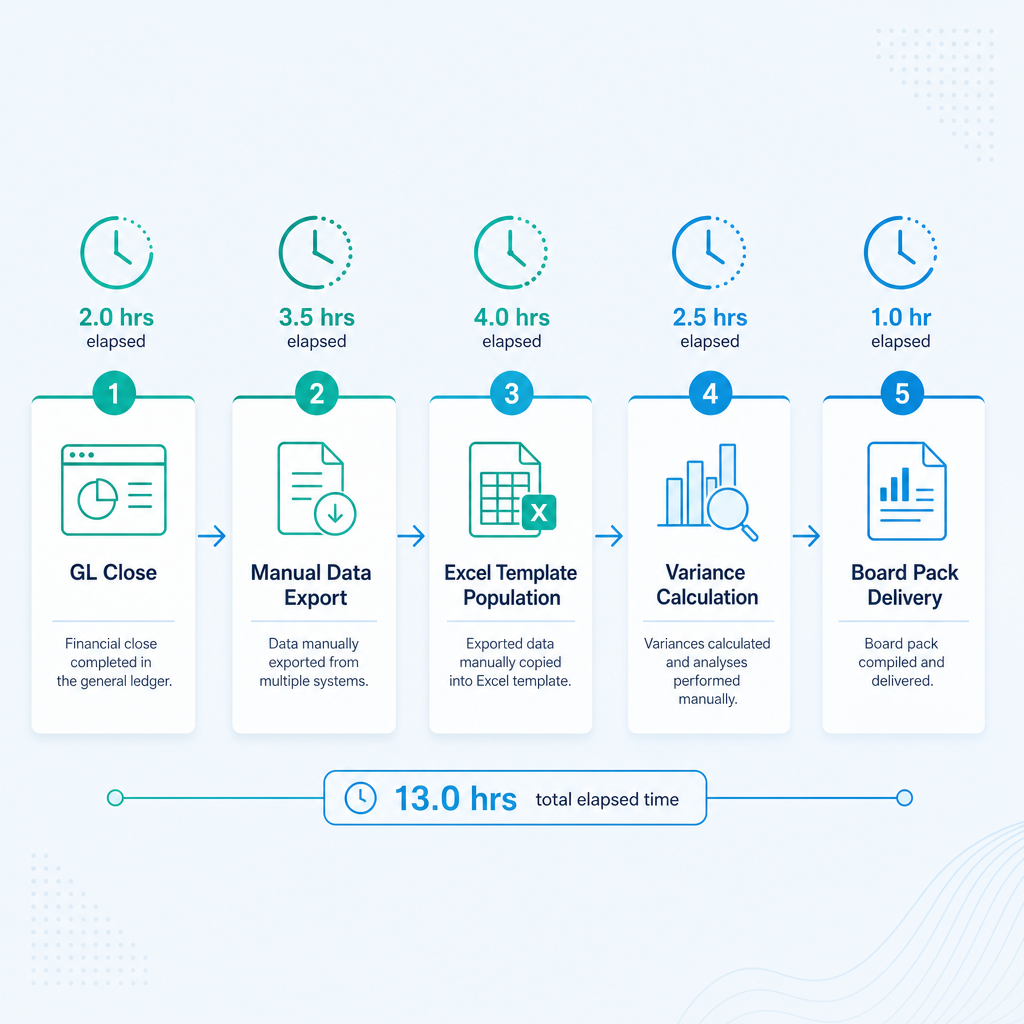
The close cycle and the reporting cycle are two different problems. Most Australian finance teams have made genuine progress on closing the books faster, yet the board pack still lands late. The reason is that close and reporting share data but run on separate workflows, and the handoff between them is almost always manual.
When close finishes, someone needs to extract the trial balance, load it into a reporting template, apply prior-period adjustments, calculate variances, pull in non-financial KPIs from a separate system, and format everything to the standard the board expects. Each of those steps involves a human making decisions, and each decision is a point where the process can stall or produce an error.
I have written in more depth about the specific bottlenecks inside month-end close if that upstream problem is where you need to start. But for teams where close is under control and reporting lag is the remaining pain, the fix is structural. You need the data pipeline from source systems to reporting outputs to run without manual intervention.
The three most common causes of reporting lag I see in Australian mid-market businesses are:
- No live connection between the GL and the reporting layer. The finance team closes Xero or MYOB, exports a report to CSV, and pastes it into a master Excel file. Every month. This is not a data problem. It is an architecture problem.
- Non-financial data living in a separate system. Operational KPIs, headcount, sales pipeline and project data sit in spreadsheets, CRMs or purpose-built tools. Someone has to gather that data manually before the board pack can be assembled.
- Commentary and narrative written from scratch. Variance notes are authored by a senior person who has to wait for the numbers before they can write. That serialises the process and concentrates workload at exactly the wrong point in the month.
All three are solvable. None of them require new software.
Data Integration: Connecting Xero, MYOB, and Legacy ERPs
The first question I get from finance teams exploring reporting automation is whether their existing systems can support it. The answer is almost always yes, though the method varies.
Xero and MYOB both offer REST APIs that allow direct data extraction. A properly built connector can pull the trial balance, transaction detail, accounts receivable ageing, and bank reconciliation status on a schedule, or in real time, without any manual export. If your reporting tool supports these connectors natively, setup is straightforward. If it does not, a middleware layer such as an Azure Logic App or a lightweight ETL pipeline handles the extraction and staging.
Legacy ERPs are a different constraint. Many Australian businesses, particularly manufacturers, distributors and operators with a long operating history, run ERP systems that predate modern APIs. These systems cannot be connected via an API because they do not have one. The conventional advice is to replace the ERP before attempting automation. I do not agree with that position.
We had a family-owned logistics operator running a twenty-year-old ERP with no APIs alongside Xero. The finance team was manually bridging the two systems each month, consuming significant time and introducing reconciliation errors across reporting. Rather than recommending a platform replacement, we built an RPA bot that drove the legacy ERP interface directly, validated extracted data against SQL, and synced clean records into Xero and live reporting dashboards, without replacing or modifying the ERP. The result was 160-plus hours of manual work recovered each month, with the legacy system retained and reporting brought into real time.
The principle here is that the existing stack is a constraint to engineer from, not an obstacle to remove. Replacing a twenty-year-old ERP is expensive, risky and slow. Automating around it is faster to ship, cheaper to run, and does not require betting the business on a platform migration.
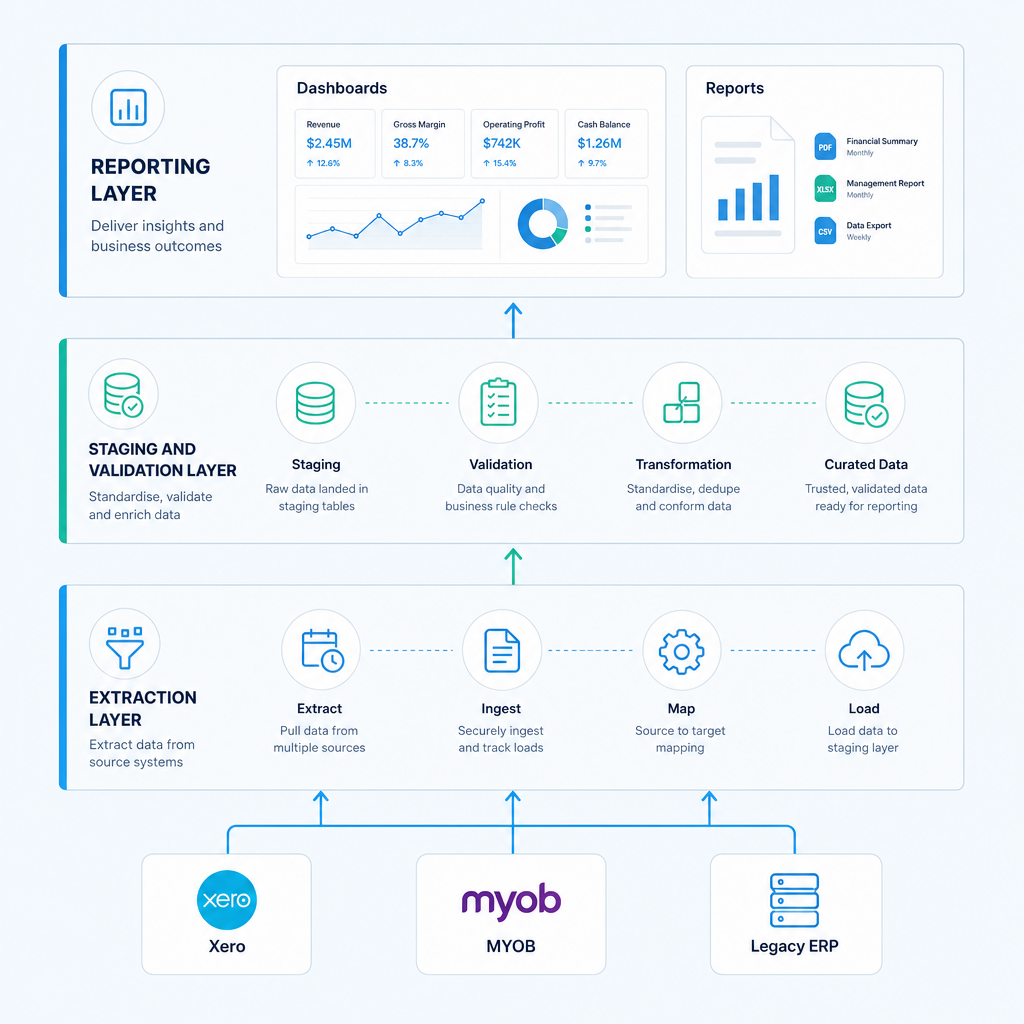
For multi-system environments, the integration architecture typically looks like this:
- Extraction layer: API connectors, RPA bots, or SFTP file drops collect data from each source system on a defined schedule.
- Staging and validation layer: Raw data lands in a SQL database or data warehouse where business rules are applied, anomalies flagged, and data quality checks run before any report is produced.
- Reporting layer: A BI tool such as Power BI, or a purpose-built reporting platform such as Ordron's, connects to the staging layer and produces live dashboards and scheduled reports.
Data quality is the gating constraint at every stage. Automation amplifies whatever is in your source systems. If your GL coding is inconsistent, your automated P&L will reflect that inconsistency at scale and with greater visibility. That is not a reason to delay automation. It is a reason to fix data quality in parallel and to build validation rules into the staging layer from day one.
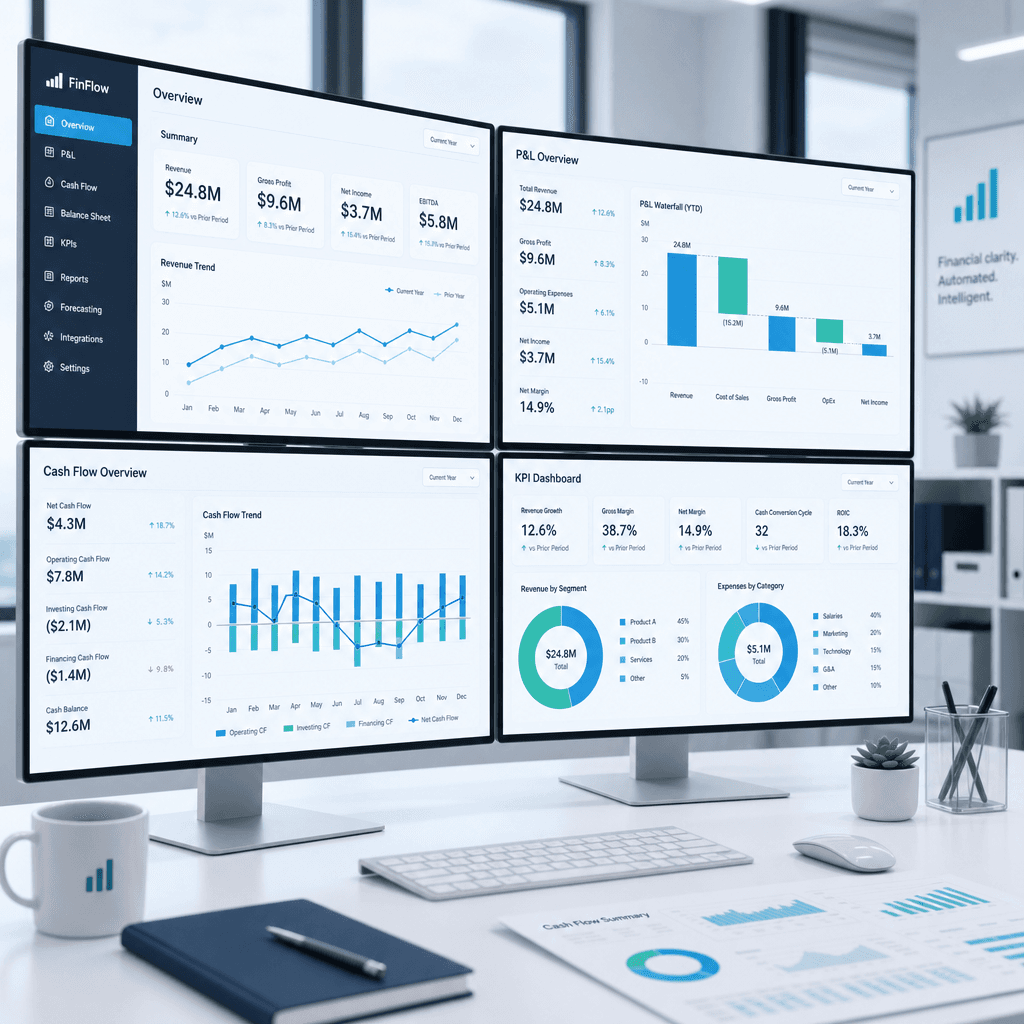
Building Automated Financial Dashboards
An automated dashboard is not a report that refreshes automatically. That is a low bar. A genuinely useful automated dashboard pulls from validated source data, applies the correct business logic for your chart of accounts and entity structure, handles prior-period comparatives without manual adjustment, and surfaces exceptions proactively rather than waiting for someone to hunt through the numbers.
For Australian businesses, the dashboard layer also needs to handle GST correctly. Reporting gross versus net figures, tracking input tax credits, and reconciling BAS positions requires that GST treatment is encoded in the data model, not handled manually each month before the data is loaded.
The dashboards we build at Ordron typically cover three tiers:
Executive tier: High-level P&L, cash position, key operating metrics, and variance to budget. Designed for board members and the CEO. Refreshes on a daily or monthly schedule depending on what the audience needs.
Management tier: Departmental P&L, cost centre analysis, headcount and project margins. Designed for department heads and operational managers. Often live or near-real-time.
Finance team tier: Detailed variance analysis, reconciliation status, aged receivables and payables, and close checklist progress. Designed for the CFO and the finance team. Live and interactive.
The architecture supports all three from the same data pipeline. The difference is what each tier surfaces and to whom. Role-based access controls determine who sees what, which is a governance requirement, not an optional feature.
We worked with a mid-sized freight operator where bank reconciliation was manual, GL coding was inconsistent, and aged-receivables visibility was delayed by days. We automated GL tagging, bank reconciliation and aged-receivables reporting directly within the existing Xero environment, requiring no platform change. The outcome was an 80 per cent reduction in AR reconciliation time, with real-time aged-receivables visibility delivered as a standard output of the automated process. The CFO described it as the first time they had confidence in their receivables position on any given day, not just at month end.
Consolidation and Intercompany Roll-Ups
For Australian businesses operating across multiple entities, whether that is a corporate group structure, a franchise network, or a family office with several operating companies, consolidation is where manual reporting is most painful and most error-prone.
Manual consolidation in Excel typically involves exporting trial balances from each entity, loading them into a master workbook, applying intercompany elimination rules, adjusting for any FX positions, and then reconciling the result. If you have four entities, this is a half-day job. If you have twelve, it is a multi-day exercise that stretches close even further.
Automated consolidation works by defining the group structure and elimination rules once, in a data model, and then applying those rules automatically each time the underlying entity data refreshes. Intercompany loans, management fees, and intercompany trading balances are eliminated at the consolidation layer without manual intervention. FX rates are pulled from a feed and applied to the correct entities based on their functional currency.
AASB 10 (Consolidated Financial Statements) and AASB 127 (Separate Financial Statements) set the framework for how Australian groups must treat consolidation for statutory purposes. Automated consolidation does not replace the statutory audit process, but it ensures that the management consolidation is produced consistently, quickly, and with a full audit trail of the rules applied. That audit trail is valuable both for internal governance and for the external audit, where auditors increasingly expect to see documented, repeatable processes rather than a series of manual Excel adjustments.
Variance Analysis and Commentary Automation
Variance analysis is where the most senior and expensive people in the finance team spend a disproportionate amount of time on work that is partly mechanical. Calculating that revenue is $240,000 below budget in the Queensland region because of a delayed project is a mechanical task. Explaining why that matters and what should be done about it is not.
Automation handles the mechanical part. Variance thresholds are defined in the data model. When actuals deviate from budget or prior period by more than the defined threshold, the system flags the variance and generates a commentary trigger, a structured prompt that tells the analyst which line, which entity, which period, and what the variance is. The analyst adds the qualitative explanation. The mechanical description is already written.
This does not eliminate the need for a human in the commentary process. It concentrates human effort on the judgement and explanation, and removes the data-gathering and calculation steps that currently consume most of the time. In teams where the CFO is personally writing variance commentary at 10pm before a board meeting, this change alone recovers hours of senior time each month.
Real-Time Versus Scheduled Reporting
Not every report needs to be live. This is a point that gets lost in conversations about reporting automation, where the default assumption is that real-time is always better. It is not. Real-time data in a report that nobody checks until month end is not a meaningful improvement. Scheduled reporting delivered reliably and without errors, on the cadence the audience actually uses, is more valuable than a live dashboard that nobody trusts.
The right answer depends on the audience and the decision being supported. Live dashboards suit operational decisions: cash position, aged receivables, daily revenue, project burn rates. Scheduled reports suit governance decisions: board packs, management accounts, BAS reconciliation. A well-designed reporting architecture supports both from the same pipeline.
ATO-Compliant and Audit-Ready Reporting
Australian finance teams operate under reporting obligations that are not optional. BAS lodgement, income tax returns, and the financial statements that feed both require that reporting systems produce accurate, traceable outputs.
Automated reporting supports compliance in several ways. First, the audit trail. Every transformation applied to the data, every rule in the consolidation model, every variance flag, is logged. That log is accessible to auditors and to the ATO if required. Second, consistency. The same rules are applied every period. There is no month where someone forgot to apply an adjustment or used last month's FX rate because they forgot to update the lookup table. Third, reconciliation between management and statutory accounts. When both are produced from the same data pipeline, reconciling differences is a comparison exercise, not an investigation.
For businesses subject to AASB reporting requirements, particularly those preparing for audit or managing relationships with institutional investors, the ability to demonstrate that management accounts are produced by a documented, automated process is increasingly expected rather than merely desirable.
If you are weighing whether the investment in automated reporting is justified for your business, the finance automation ROI calculator we published is a useful starting point for putting numbers on the decision.
From Excel to Enterprise: What the Case Studies Show
I am aware that case studies can be used to sell outcomes that do not generalise. So I will be specific about what the work we have shipped actually shows.
In the distribution on-demand reporting engagement, the challenge was a finance team producing management reports across multiple distribution entities, where each entity's data lived in a separate system and consolidation was done manually. The automation we shipped connected each entity's source data, applied consolidation rules, and produced a live management pack. The finance team went from spending most of a week on consolidation to reviewing an automated output and adding commentary in hours.
In the Excel-to-enterprise engagement, the starting point was a business running its entire reporting function out of Excel workbooks that had accumulated over years. The risk was not just inefficiency. It was that the reporting was brittle: a broken formula or a mis-pasted range could produce a materially incorrect board pack. The automation replaced the Excel layer with a structured data model and a reporting tool connected to the source systems. The output is identical in format to what the board was used to receiving. The process producing it is entirely different.
Both engagements were built on existing systems. No new ERP. No platform replacement. The exact automation shipped was designed around the constraint, and the results were measured after go-live.
Prerequisites and Realistic Caveats
I want to be direct about what makes reporting automation fail, because the failure modes are predictable and avoidable.
Data quality. If your chart of accounts has evolved organically over a decade and GL coding is inconsistent, automated reporting will surface those inconsistencies immediately. That is useful information, but it means the first phase of any automation engagement often involves a data quality remediation that was not anticipated. Budget time for it.
Governance. Automated reports still need owners. Someone needs to review the outputs, approve the board pack, and sign off on the variance commentary. Automation does not remove the need for human judgement in the governance chain. It removes the manual work that precedes that judgement.
Change management. Finance teams that have run on Excel for years have institutional knowledge embedded in those spreadsheets. Some of that knowledge is business logic that needs to be documented and encoded in the new system. Some of it is workarounds that should be eliminated. Telling the difference requires time and collaboration with the team.
Integration complexity. Connecting three cloud systems via APIs is straightforward. Connecting a cloud system, a legacy on-premise ERP, and a bespoke inventory tracker requires more engineering. The complexity is manageable, but it needs to be scoped accurately before a timeline is committed to.
These are not reasons to avoid automation. They are the real conditions you will be working within, and a provider who does not raise them upfront is not being honest with you.
If you want to see whether automated financial reporting is the right next step for your team, the place to start is a conversation about your specific stack and your specific bottleneck. You can reach us here.
References
-
Australian Bureau of Statistics, Australian Industry publication, ABS data on the financial and insurance services sector in Australia, including employment and output metrics that provide context for the scale of finance function activity in Australian businesses.
-
Australian Accounting Standards Board, AASB 10 Consolidated Financial Statements, The authoritative standard governing consolidation requirements for Australian reporting entities, relevant to any automated consolidation implementation.
-
Australian Accounting Standards Board, AASB 127 Separate Financial Statements, Companion standard to AASB 10, governing the treatment of investments in subsidiaries in separate entity accounts.
-
Australian Taxation Office, Business Activity Statement guidance, ATO published guidance on BAS lodgement requirements, GST treatment, and the record-keeping obligations that apply to Australian businesses and their financial reporting systems.
-
CPA Australia, AI-Enhanced Automation in Financial Reporting course documentation, CPA Australia professional development material on the application of AI and automation in financial reporting contexts, providing a professional standards perspective on the shift toward automated outputs.
-
OAIC, Australian Privacy Principles guidelines, Office of the Australian Information Commissioner guidance on the Privacy Act 1988 and the Australian Privacy Principles, relevant to any automation system handling financial data about individuals or connected to cloud services.
-
Microsoft Power BI documentation, Australian data residency and compliance, Microsoft's published documentation on data residency options and compliance certifications for Power BI deployments in the Australian market, relevant to security and privacy design decisions.
-
Xero, API documentation and developer resources, Xero's published API reference, describing the data entities and endpoints available for automated extraction from the Xero platform, directly relevant to reporting integration architecture.
Frequently asked questions
- What tools are commonly used for financial reporting automation in Australia?
- The most common combination in Australian mid-market businesses is a cloud accounting platform such as Xero or MYOB as the GL, a BI tool such as Microsoft Power BI or Tableau for dashboards, and a middleware or ETL layer to connect them. For businesses with legacy ERPs, RPA tools such as UiPath or Microsoft Power Automate are used to extract data from interfaces that do not support API connections.
- How much does financial reporting automation cost in Australia?
- Cost depends on the complexity of your system environment and the scope of what you want to automate. Well-scoped engagements for mid-market Australian businesses typically range from $15,000 to $80,000 AUD depending on scope, with ongoing maintenance costs that are a fraction of that annually. The more useful question is what the current manual process costs in salary time each month and whether the automation pays back within a defined period.
- How long does it take to implement automated financial reporting?
- For a straightforward single-entity implementation on Xero or MYOB, a basic automated reporting layer can be operational in four to eight weeks. For multi-entity consolidation with legacy system integration, twelve to twenty weeks is a realistic timeline. Scope creep and data quality remediation are the two most common causes of extended timelines.
- Should we use Excel or a BI tool for financial reporting?
- Excel is appropriate for ad hoc analysis and for genuinely one-off outputs. It is not appropriate as the production system for monthly board packs, consolidated management accounts, or any report where accuracy, timeliness and auditability matter. BI tools connected to validated source data eliminate the risk of broken formulas, mis-pasted ranges, and version control failures that affect Excel-based reporting processes.
- How accurate is automated financial reporting compared to manual processes?
- When automated reporting is built on a validated data pipeline with properly defined business rules, it is more accurate than manual reporting. Manual processes introduce transcription errors, formula errors, and version control failures that automated processes do not. Across Ordron's engagements, greater than 95 per cent coding accuracy has been achieved using intelligent document understanding.
- Is automated financial reporting secure and compliant with Australian requirements?
- A properly built reporting automation system applies role-based access controls, encrypts data in transit and at rest, and maintains audit logs of every transformation. For businesses subject to the Privacy Act 1988 and the Australian Privacy Principles, data handling within the reporting pipeline must comply with those requirements, particularly if cloud services hosted outside Australia are involved.
- Can reporting automation work with our existing Xero or MYOB setup without replacing it?
- Yes. Xero and MYOB remain the GL. The automation layer sits on top of or alongside them, extracting data via API, applying reporting logic, and producing outputs. In cases where legacy ERPs are involved, RPA can extract data from the interface directly without replacing the underlying system.
- What Australian-specific requirements should be considered when automating financial reporting?
- GST must be treated correctly in all financial reports, with BAS reconciliation positions trackable from the reporting layer. Multi-entity groups need to follow AASB 10 for consolidation. ATO audit requirements mean data supporting any lodged return must be traceable from source. These requirements need to be encoded in the data model from the beginning, not retrofitted after implementation.
Ordron
Finance automation team, Sydney
Ordron builds the finance automation infrastructure that runs AP, AR, reconciliations and reporting on autopilot for Australian mid-market businesses.
More from the Ordron Insights catalogue
Selected by topic. Updated as the agent publishes.
Financial Reporting Automation: A Step-by-Step Guide for Australian Finance Teams (2026)
If your finance team is still spending the first two weeks of every month pulling data from spreadsheets, chasing department heads for figures, and manually…
Payroll Automation in Australia: A Practical STP & Single Touch Payroll Guide for Finance Teams (2026)
Payroll in Australia is not complicated because the maths is hard. It is complicated because the obligations are layered, the data sits in multiple systems,…
How to Automate Expense Management in Australia: A Practical Guide for Finance Teams
Australian finance teams are losing time they cannot afford to lose. Chasing receipts, manually checking claims against policy, reconciling corporate card…